"The word tariff, properly used, is a beautiful word, one of the most beautiful words I've ever heard, it's music to my ears. A lot of bad people didn't like that word, but now they're finding out I was right.[1]" – Donald Trump
Tariffs have been a key policy stance in the 2024 US presidential campaign, with both Republicans and Democrats supporting maintaining or increasing tariffs. Trump has the most aggressive stance, proposing a 60% tariff on Chinese goods and a 10% tariff on all other countries’ imports. While these proposals are not set in stone, and with a tight race to the White House, the potential impact of such policies on global listed infrastructure (GLI) sectors and companies are important to assess.
Infrastructure stands at the crossroad of global trade – ports allow for the movements of goods across the seas, while goods are moved from ports to demand centres by railway and road infrastructure. Tariffs also have a potential impact on countries’ growth and inflation outlook, which impacts the macroeconomic variables driving infrastructure’s long-term return outlook.
Background
Global trade boomed after China joined the World Trade Organization in 2001, helping millions escape poverty in China – a net benefit for global growth. However, growing populism in the West, driven by working class concerns about globalisation, has pushed leaders away from free trade. This has led to a rise in policies aimed at protecting local industries and jobs, even though they may harm the economy.
This gained momentum in 2018, with the initiation of President Trump’s trade war with China and the Section 301 tariffs. The US raised tariffs on $250 billion worth of Chinese goods, aiming to protect US companies and lower the trade deficit. In response, China imposed tariffs on $110 billion of US goods, causing a sharp drop in trade between the two countries for the taxed goods. At an aggregated level, imports of Chinese goods subject to the highest tariff rates did not start falling and diverging from ROW imports until after tariffs kicked in.
US imports from China and ROW by trade war tariff list, 2018-2022
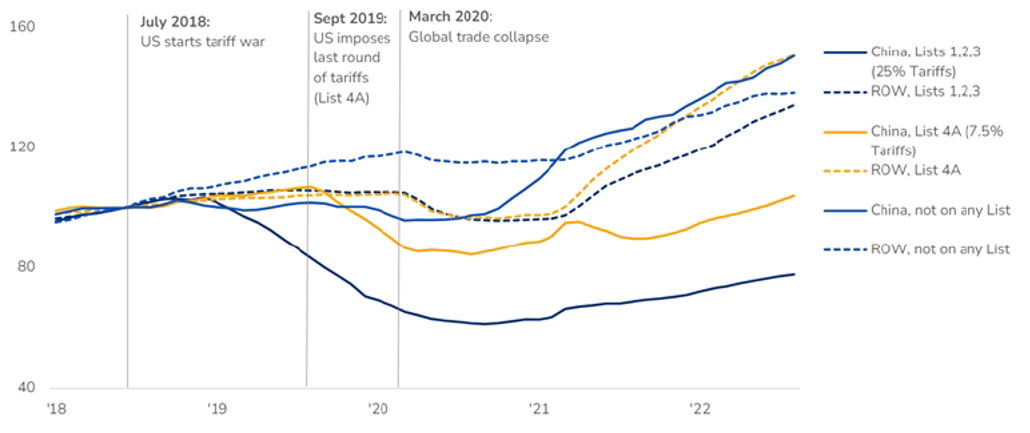
Source: Chad P Brown, 2022 “Four years into the trade war, are the US and China decoupling?”, PIIE Economic Issues Watch
More recently, in May 2024, the Biden administration released its four-year Section 301 review. Biden stated China continues to “flood global markets with artificially low-priced exports”, and was increasing tariffs on a further $18bn of Chinese imports “to strengthen actions to protect American businesses and workers from China’s unfair trade practices”. After the review finalisation in September 2024, tariff rates increased to 100% on Chinese electric vehicles, 50% on solar cells, and 25% on EV battery parts, critical minerals, iron, steel and aluminium.
The 2024 US presidential race
Broadly speaking, Harris is seen as maintaining the status quo with tariffs, while Trump is proposing a return to the disruptive and highly political trade wars of 2018/19, but on a far greater magnitude.
Both candidates are polling within the margin of error to win the presidency, but there is uncertainty as to a red sweep (Republican presidency, House and Senate), or a divided house (Republican Senate, Democratic House and presidency). As such, there are potentially several iterations of what a final tariff policy looks like.
| Harris | Trump |
| Continued use of tariffs to protect selected industries. |
|
Trump has existing scope within Section 301 that would allow him to increase tariffs as proposed. His targeting of other countries with high bilateral trade balances, such as the EU, will further heighten uncertainty around certain goods’ trade and the economy. ‘Across the board’ tariff ideas could still impact FTA countries such as Mexico - with Trump positioning to use the review of the USMCA (which replaced NAFTA in 2020) to win concessions from Mexico on immigration and Chinese investment.
The Trump 2.0 proposals go far beyond the proposals of Trump’s first term in office - the existing tariff proposals will be the highest since the 1930s – and be far broader than just focusing on China. Customs duties as a % of GDP would increase 7x to 2% of GDP on a static basis (ignoring the inevitable substitution away from tariff exposed Chinese imports).
US weighted- average tariff rate 1920-23
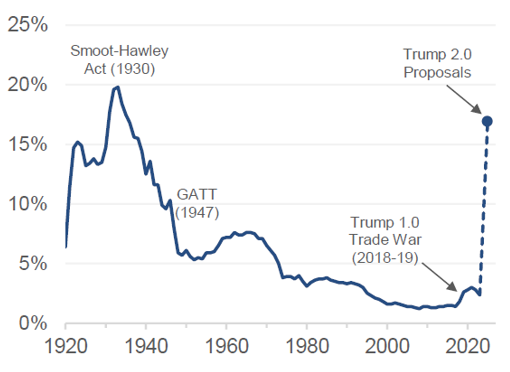
Source: Census Bureau, US International Trade commission, Evercore ISI
Trump has suggested a 200% tariff on Chinese EVs. – however, these vehicles are largely built in other markets, such as Mexico, Vietnam or in US partnerships – making the tariffs mostly ineffective. The Biden administration has focused on the security aspects of Chinese cars and use of Chinese software. This is part of a larger trend of decoupling in areas where there is technological innovation – Biden is using export controls on semiconductors and input controls from Foreign Entities of Concern for EVs and semiconductors. Meanwhile, Trump is using tariffs to address these challenges. Either way, election speeches and policy guidance from both Republicans and Democrats are focusing on this intersection of technology, the economy and national security.
Americans are largely pro tariff, and thus more receptive to Trump’s plans. 56% of voters in a September 2024 Reuters/Ipsos poll said they support a 10% ROW and 60% Chinese tariff. Considering this support, both sides are focusing on protecting the domestic manufacturing sector and global competitiveness, targeting swing states and the ‘blue wall’ of the industrial Midwest.
There is, however, some backlash even among Republicans as to the level of tariffs Senate Republican Leader Mitch McConnell saying as recently as 24th September 2024, that he is “not a fan of tariffs” as they tend to increase costs for American consumers.
In regard to timing, tariff headlines will no doubt have an impact on sentiment from day one of a Trump presidency. However, actual tariffs may not take effect until well into late 2025 for Chinese tariffs and 2026 for ROW tariffs due to trade partner negotiations, public comment periods and investigations.
Impact on economies
"And we will take in hundreds of billions of dollars into our treasury and use that money to benefit the American citizens. And it will not cause inflation, by the way.” – Donald Trump
The macroeconomic impact of tariffs cannot be measured in isolation – Trump is aiming to largely pay for extensions to the 2017 Trump tax cuts by raising tariffs (which still leaves a >$4trn budget hole to fill). On their own, tariffs are broadly negative for US growth, boost inflation and put the Fed on hold (or on a slower path down).
Bloomberg, using a general WTO equilibrium model, assessed the impact of Trump’s proposed tariffs on trade flows and the impact on GDP. Mexico and Canada, close trading partners who are heavily tied to US demand, are hardest hit, with GDP 2% lower by 2028 vs a baseline of current tariffs. They estimate a modest impact on China, with 0.4% GDP impact if Beijing imposes retaliatory tariffs. Overall, this has a 0.4% impact on global growth by 2028.
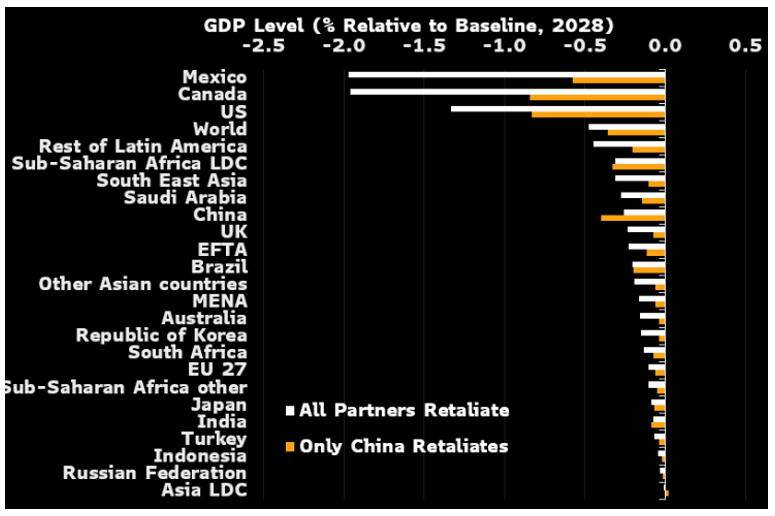
Source: Bloomberg
Under a scenario in which all countries retaliate, total US goods imports are down 54% and exports 63%, relative to a baseline with no tariff changes. Trade with the rest of the world increases and, for most countries, offsets much of the drag from lower trade with the US (except Mexico and Canada). This would lead to a lower weight and influence of US in global trade, with US origin/destination goods trades falling from 20% of global trade to 8.5%.
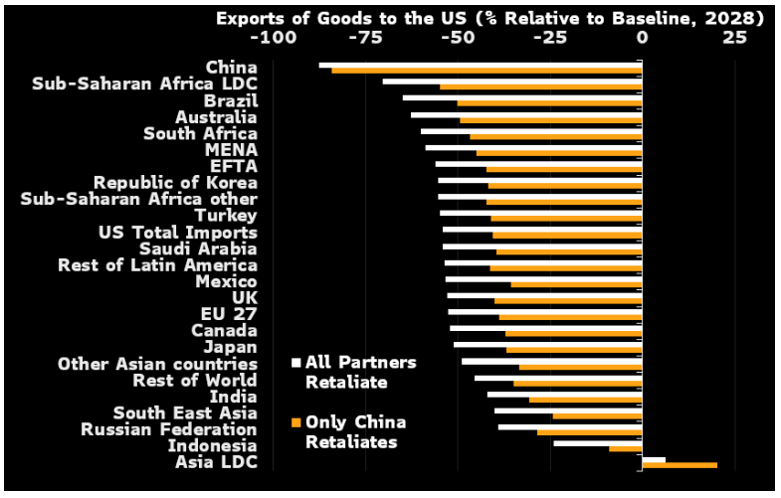
Source: Bloomberg
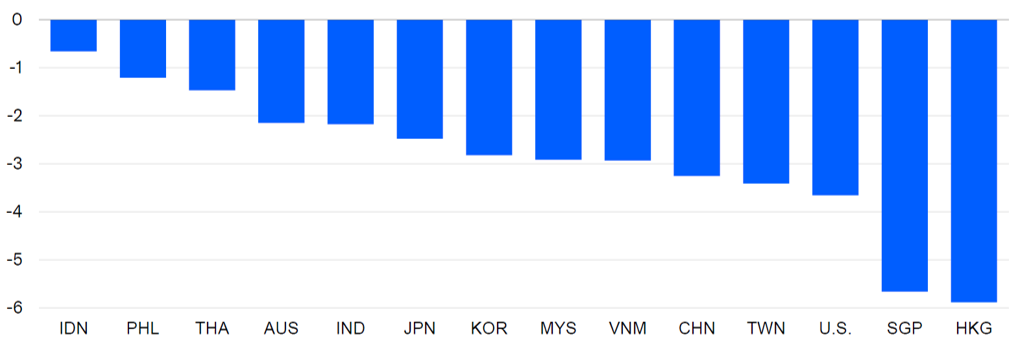
Moody’s estimates larger impacts on Asia, averaging a 3% GDP hit under a Republican sweep scenario, compared to the baseline impact of tariffs from a democratic win and divided congress. This is even greater in China and Hong Kong, where the impact is not only from tariffs, but also from diminished consumer confidence (with a weaker labour market and capital spending feedback loop to consumption). Importantly, one of the hardest hit is the US itself.
Real GDP, Republic sweep scenario peak % deviation from baseline
Source: Moodys Analytics
There is some debate on the actual net impact and benefit of such large tariffs on the US fiscal outlook. On a static basis, a 60% Chinese tariff would generate $2.4trn of net new revenue over 10 years, assuming $5.6trn of goods imports from China 2026-35. However, once changes in trade behaviour are considered, the policy net benefit could be much lower at ~$300bn to even a loss of $50bn, according to the Committee for a Responsible Federal Budget.[2]
This is because Chinese trade will be absorbed by domestic production or other countries (subject to the 10% tariff). US imports of Chinese goods could reduce by 85%. The Tax Foundation estimates that the current Trump-Biden tariffs will reduce long run GDP by 0.2% and employment by 142,000 FTE jobs[3]. These policies are equivalent to an increase of $79bn, or $625 annual tax increase per US household. The Tax Foundation also estimates Trump’s current proposals could shrink GDP by 0.8% and employment by 684,000 FTE jobs.
In the US, 20% of US consumer goods are imported, with household appliances and computers very high (20-30% Chinese imports). Even assuming a 60% Chinese tariff and a more conservative 4% ROW UBT tariff, Wolfe estimate that this would cut Chinese imports by 25% of these goods and increase 2026 core PCE inflation by 50bps.
Europe would also be impacted by an inflation spike – with a small offset by some Chinese dumping of goods that can no longer be sold into the US competitively. The large effect of a Trump 2.0 trade war could further dampen weak European growth momentum.
Impact on global listed infrastructure
Aside from the macroeconomic impact detailed above, the shifting of global trade movement and adjusting of supply chains will directly impact ports, road and rail stocks that are responsible for moving much of these goods. There is also some impact on the midstream sector that exports gas to China, as well as utilities, which may be impacted by supply chain disruption and input cost inflation for their large renewables build out.
An important consideration when assessing the impact of Trump’s potential tariffs on a company’s stock valuation, is the assumption that Trump will be implementing the tariffs as part of a wider set of economic policies – such as lower taxes, cutting regulation and re-shoring. Trump is proposing to cut the corporate tax to as low as 15% from 21%, which has a much more positive immediate impact to company cashflows than the potentially lower volumes in 2025-26. Tax reform will also enhance cashflows which can be used for bringing forward growth capex or increase buybacks or dividends.
North American rail
The listed North American rail stocks move freight from ports to demand centres across the US, Canada and Mexican rail networks. US rail would be more impacted than Canadian rail companies, where international intermodal revenues (which are port-related volumes) account for 8-10% of revenues. Canadian Pacific Kansas City and Union Pacific have the highest portion of revenues exposed to Mexico, which account for 13% and 12% of group revenues respectively.
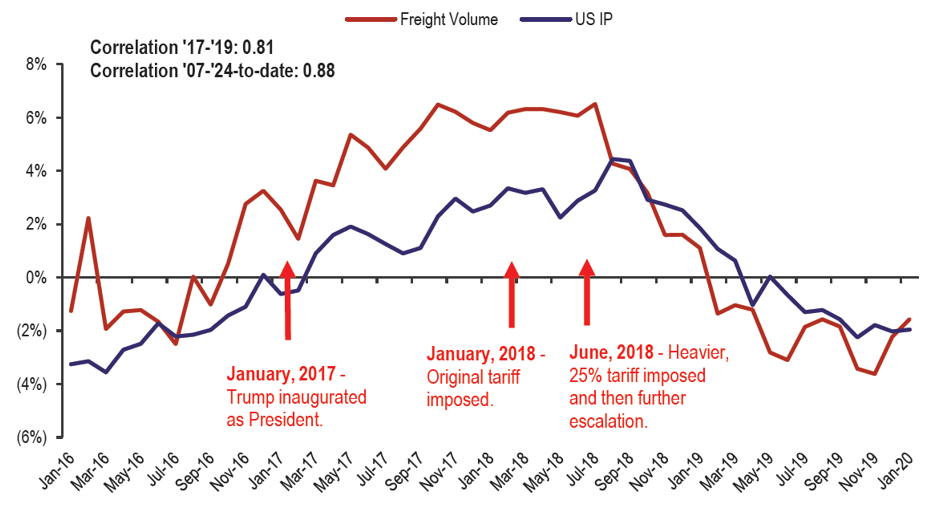
While various commodity groups involve trade with Mexico, we believe automotive cargoes would be among the hardest hit. There is no doubt tariffs will reduce US freight volumes, as seen below, but this is also shared across trucking. Medium term, there could be a substitution of lost Chinese volumes to ROW country volumes (the ‘bystander effect’).
Freight volumes vs US industrial production
Source: AAR; Cass Information Systems; IATA; ATA; Public LTLs; FactSet; Bloomberg; Wells Fargo Securities, LLC
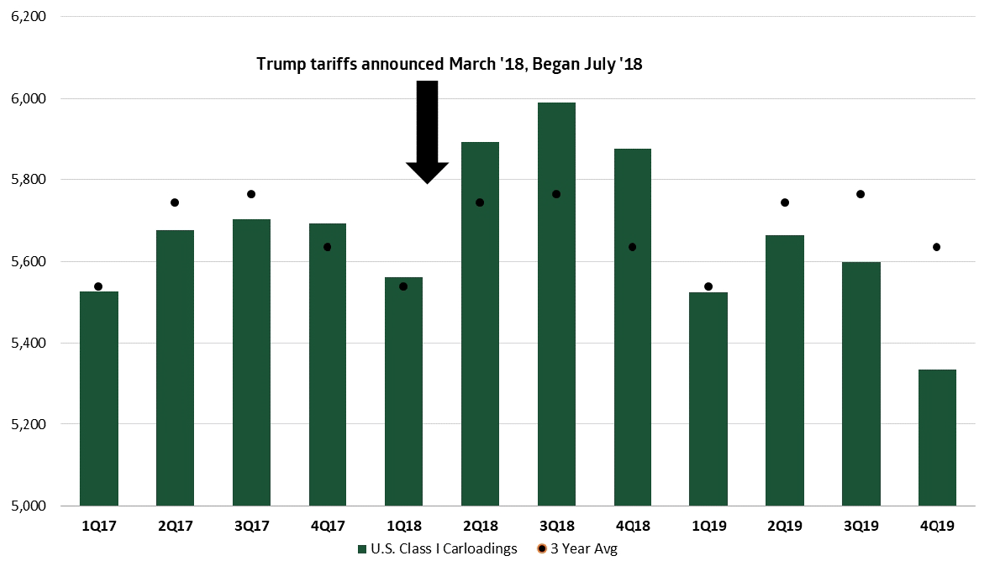
It’s important to split the short-term and long-term impacts of tariffs. Shorter term, for rail, there is some bring forward of freight volumes ahead of implementation, followed by lower volumes. Longer term, and more importantly for long-term valuations, is the impact on US industrial production, manufacturing sectors and the standing of the US in global trade, and thus port/rail/road volumes.
US carloadings during 2018 Trump tariffs
Source: TD Cowen
As discussed above, these tariffs are being implemented along with other advantageous corporate tax measures, so the impact on the rail valuations must be viewed more holistically. For example, a 15% federal income tax would lead to a 7-8% EPS accretion immediately for the US rails (UNP, CSX, NSC). Overall, the US rails are seen as beneficiaries of nearshoring as the more intermediate goods around domestic manufacturing centres, and both raw materials and finished goods, can be transported. The level of this offset vs losing imported finished goods is uncertain – both in size and time frame – but they could well be net beneficiaries of Trump’s policy shifts.
Ports and global trade volumes
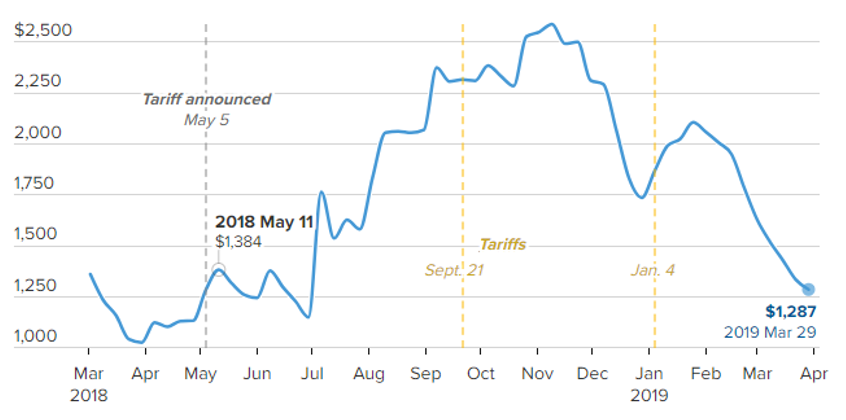
There are no listed US ports. The GLI port universe consists of listed assets in China, ASEAN and Latin America. The impact from the 2018 trade war was far greater on shipping companies than the ports on import timing and spot container rates. Importers pulled forward cargoes in the second half of 2018 to beat tariff deadlines, leading to a doubling of spot rates. The inventory overhang subsequently put pressure on rates in 2019.
Jason Miller, a freight economist and professor of supply chain management at Michigan State University, said that if Trump’s proposed tariffs were implemented then “we will see front-loading like we have never seen before in 2025. There would be a massive pull-forward of demand as everybody rushes to bring in long-life inputs and goods from tariff countries, especially China.”
Tariff impact on ocean freight prices, China to North America west coast 2018-19
Source: Freightos Baltic Index
Again, the longer-term impact on ports depends on their port network, the origin/destination of their goods, the level of transhipment and the main commodity types that go through their network. In Southeast Asia, countries such as Thailand and Vietnam benefited from a re-organisation of supply chains from mainland China post-COVID to evade tariffs. A lot of these shifts in production patterns are real, albeit with intermediate goods with little value-add. Deeper trade integration within the ASEAN region will continue at pace with Trump 2.0 tariffs – and this should benefit ports in these regions, such as ICT in the Philippines, and Westports in Malaysia.
Evidence from the 2018 trade war showed that US-China trade reduced bilateral trade flows, with US exports to China falling by 26% while exports to the ROW fell only 2%. China’s exports to the US declined by 8.5% and exports to the ROW rose by 5.5%. These bystander countries increased their exports to the US and the rest of the world, and, according to the National Bureau of Economic Research (NBER), global trade increased overall[4]. They found that the relative winning countries with strong export growth were selling products that substituted for those previously supplied by US or China, and were highly integrated internationally (e.g. high FDI and trade agreements). For example, France increased its exports to the US and ROW, while Spain increased its exports to the US, but its ROW exports shrank. Philippines saw reduced exports to the US and ROW.
North American midstream
Companies that support the supply chain for US LNG exports, notably Cheniere Energy and Williams Co, have rapidly grown their export LNG infrastructure in the past decade. These include the signing of long-term offtake agreements with importers (utilities) in countries such as China, South Korea and Japan and end users in Europe. In the first Trump trade wars, China imposed a 10% tariff on US LNG shipments in September 2018, raising it to 25% in June 2019. At the time, there was restrained US LNG flow to China and talks slowed regarding US capacity expansions.
US LNG exports
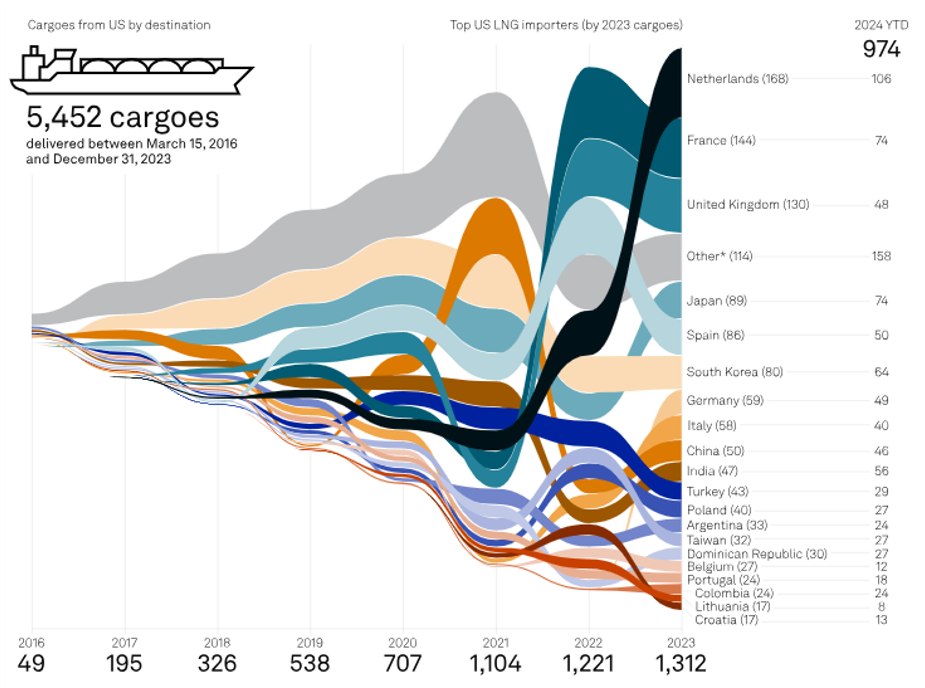
Source: S&P Global Commodity Insights, Data as of 25 September 2024
For the US listed midstream companies involved in the LNG supply chain, the prospect of Trump 2.0 trade wars, and further retaliatory tariffs from China on LNG imports, are mixed. Firstly, assuming existing long-term contracts and pricing structures are honoured (between the US exporter and the Chinese importer) – it’s the Chinese importer that will pay the higher tariffs. We see little risk of existing contracts being impacted or not honoured, or pricing amended.
Secondly, there is a potential impact on the build out of further terminals for the US exporters, and future development growth. However, China currently accounts for only 11% of LNG exports, and we expect other end markets could potentially absorb any demand weakness. Furthermore, for the Chinese, they would then have to maintain their security of supply by securing contracts with other exporting nations with available supply, such as Australia and Qatar – which would have to be competitive. It could represent an opportunity for infrastructure operators in these alternate markets if they are increasingly competitive.
In January 2024, Biden halted reviews of US LNG export facility applications to countries that lacked FTAs with the US in a largely political move. This has had little impact to date as LNG developers focus on other development priorities, and the expectation that export application approvals will resume post-election, irrespective of the winner. Despite this, there are some concerns for future growth. The Centre for the LNG trade group in the US stated, "until we can convey accurately what's going to happen and what it's going to look like from a regulatory environment here in the United States, it has the potential to delay commercial proceedings for some of these projects that are stuck in non-FTA purgatory right now". Importantly, we don’t value blue sky growth, so any delays or slowing of export growth should not impact existing valuations.
North American utilities
Utility returns are highly regulated in the US. If the wider set of proposed Trump economic policies are inflationary, as feared by several economists, this may impact the nominal nature of the rate of return mechanism used to calculate returns. Much like 2023, near-term earnings could be squeezed, but regulatory mechanisms are designed to accommodate economic shifts over time. There are also potential benefits from the policies, such as a focus on re-shoring manufacturing, which should boost demand loads for the utilities.
In the potential tariff wars, as well as the potential repeal of some aspects of the Inflation Reduction Act (IRA), there is a risk that some input costs of the renewables build out could increase, such as cells and panels. Note that Biden has already announced plans to increase US import tariffs on Chinese solar cells and panels from 25% to 50%. Any additional Trump measures could increase the capex cost of US utility scale solar projects by reducing competition across manufacturers. In May 2024, after Biden put these measures in place, GLI renewable developer, EDPR confirmed that they expected the measures would increase US utility scale solar project costs. Offsetting this, however, is the reason that overall costs have fallen in recent years.
A Morgan Stanley report outlined the average pace of cost decline has been much faster than anticipated in 2023, with equipment costs falling at twice the pace of the past decade's average. Low prices and below-cash-cost economics for most supply chain equipment producers in China is not stopping the buildup in equipment capacity elsewhere as tariff protection is supportive domestically. But tariffs and near-shoring of supply chains have made for an uneven deflationary impact globally and among technologies, with Asia seeing solar module costs halve against declines of 10-30% in the US and Europe since the peak in 2022.[5]
As with the utilities, the renewable developers could also be hit from any structurally higher-than-expected interest rates as a result of the tariffs. Again, these impacts should be relatively short-lived as future contracts would accommodate the changes.
Conclusion
The winner of the 2024 US presidential race is likely to remain a coin toss all the way to polling day.
Trump is proposing the largest tariffs since the 1930s, and customs duties seven times those of the Trump 1.0 trade wars in 2017-19. There are many variables and unknowns, however, on their own, Trump’s tariffs will hit growth most domestically and in Mexico and Canada, and have upside risk to US inflation. Global trade will reduce between the US and China – but bystander countries should pick up the void of these import and export volumes. This leads to new winners and losers from an economic point of view, and in global trade market share – and with that, ports who move these goods.
US rail and roads may be hit from lower volumes initially, but a re-shoring of domestic manufacturing should benefit in the long term. More importantly, Trump’s tariffs need to be viewed as a package with other Trump economic policies, including lower corporate taxes, lighter regulation and re-shoring. All these factors mean the US rails and roads could be a net beneficiary of these economic plans, regardless of potential negatives from tariffs.
Regardless of who wins the election, tariffs will remain elevated and at risk of a step change higher, with geopolitical consequence and plenty of noise and sentiment during the first year in office. There are macroeconomic consequences, as well as impacts on US and global rail and road, global port dynamics and energy demand in general – both short term and long term.
At 4D, we aim to look through this noise to the long-term and consider both the tariff impact and wider economic proposals, impact on cashflows, stability of returns and volume risk. While many of these are highly uncertain at present, we remain vigilant to the potential downside and upside risk to infrastructure assets in our universe.
The content contained in this article represents the opinions of the authors. This commentary in no way constitutes a solicitation of business or investment advice. It is intended solely as an avenue for the authors to express their personal views on investing and for the entertainment of the reader.
[1]. Trump, 25 September 2024
[2]. https://www.crfb.org/blogs/donald-trumps-60-tariff-chinese-imports
[3]. https://taxfoundation.org/research/all/federal/trump-tariffs-biden-tariffs/
[4]. “How the US-China Trade war affected the rest of the world”, 2022 NBER, Fajgelbaum, Goldberg, Kennedy
[5] At a Tipping Point; Morgan Stanley; 29/09/2024
